
[Python] 파이썬 그래프 그리기/ matplotlib 패키지 사용법
matplotlib 패키지
matpltlib import
import matplotlib.pyplot as plt기본적인 그래프 그려보기
import matplotlib.pyplot as plt #그래프 그리는 패키지 import

x = [10,20,30,40,50]
y = [10,20,30,40,50]

plt.plot(x, y, color = 'blue', marker = 'o', alpha = 1, linewidth = 1)
plt.xlabel('y')
plt.ylabel('X')
plt.show()  #그래프 띄어주기
plot 함수
plt.plot(x, y, color = 'blue', marker = 'o', alpha = 1, linewidth = 1)
Plot types — Matplotlib 3.5.0 documentation
Overview of many common plotting commands in Matplotlib. Note that we have stripped all labels, but they are present by default. See the gallery for many more examples and the tutorials page for longer examples. Unstructured coordinates Sometimes we collec
matplotlib.org
x, y
점의 위치다. 예제에서는 리스트로 x, y 위치를 지정했다.
plt.plot(x, y, color = 'blue', marker = 'o', alpha = 1, linewidth = 1)
color
plt.plot(x, y, color = 'blue', marker = 'o', alpha = 1, linewidth = 1)marker
plt.plot(x, y, color = 'blue', marker = 'o', alpha = 1, linewidth = 1)matplotlib.markers — Matplotlib 3.5.0 documentation
matplotlib.markers Functions to handle markers; used by the marker functionality of plot, scatter, and errorbar. All possible markers are defined here: marker symbol description "." point "," pixel "o" circle "v" triangle_down "^" triangle_up "<" triangle_
matplotlib.org

alpha
plt.plot(x, y, color = 'blue', marker = 'o', alpha = 1, linewidth = 1)linewidth
plt.plot(x, y, color = 'blue', marker = 'o', alpha = 1, linewidth = 1)아무런 세팅 없이 그래프 그리기
import matplotlib.pyplot as plt #그래프 그리는 패키지 import

x = [10,20,30,40,50]
y = [10,20,30,40,50]

plt.plot(x,y)
plt.xlabel('y')
plt.ylabel('X')
plt.show()  #그래프 띄어주기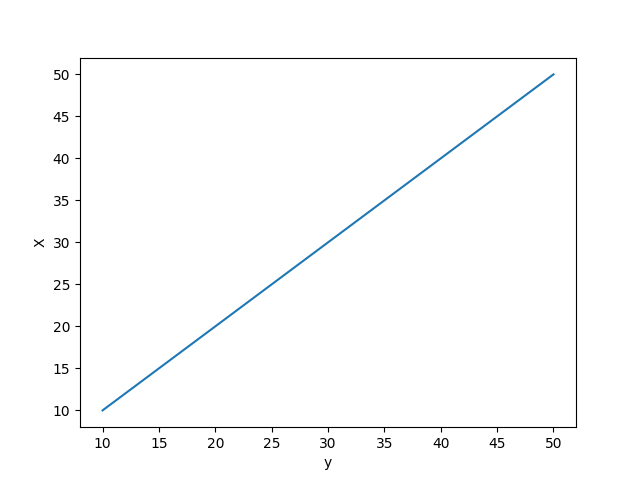
산점도 그려보기
import matplotlib.pyplot as plt #그래프 그리는 패키지 import

x1 = [10,20,30,40,50]
y1 = [10,20,30,40,50]

x2 = [100,200,300,400,500]
y2 = [100,200,300,400,500]

plt.scatter(x1, y1)
plt.scatter(x2, y2, marker = "*")

plt.xlabel('x')
plt.ylabel('y')
plt.show()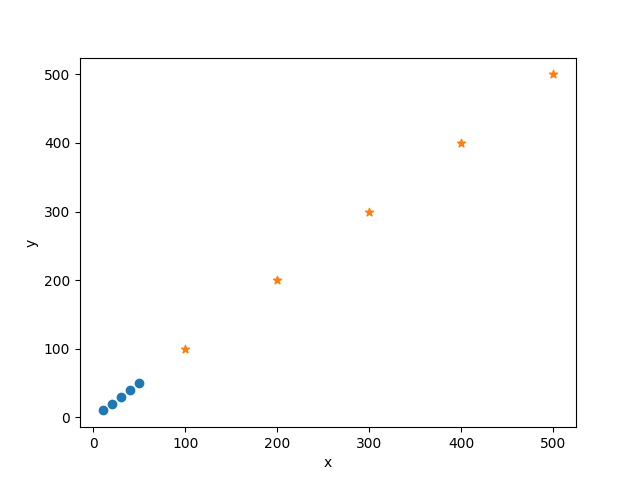
마치며
C언어로 코딩을 시작한 나에게는 파이썬에서 제공하는 기능들이 놀랍기만 하다.
https://matplotlib.org/3.5.0/index.html#
Matplotlib documentation — Matplotlib 3.5.0 documentation
matplotlib.org